用polar函数绘极坐标图。其调用格式为:
polar(theta,rho) 根据角度theta和半径rho创建极坐标图。
polar(theta,rho,LineSpec) LineSpec指定极坐标图中直线的线型、标记和颜色。
下面绘制一个简单的极坐标图。
code.matlab
t=0:.01:2*pi;
polar(t,sin(2*t).*sin(2*t),'--r')
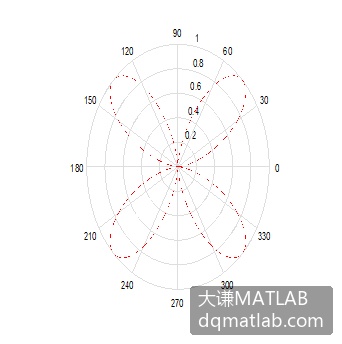
如图2-9所示。
\[\]
图2-9 极坐标图
用polar函数绘极坐标图。其调用格式为:
polar(theta,rho) 根据角度theta和半径rho创建极坐标图。
polar(theta,rho,LineSpec) LineSpec指定极坐标图中直线的线型、标记和颜色。
下面绘制一个简单的极坐标图。
t=0:.01:2*pi;
polar(t,sin(2*t).*sin(2*t),'--r')如图2-9所示。
图2-9 极坐标图