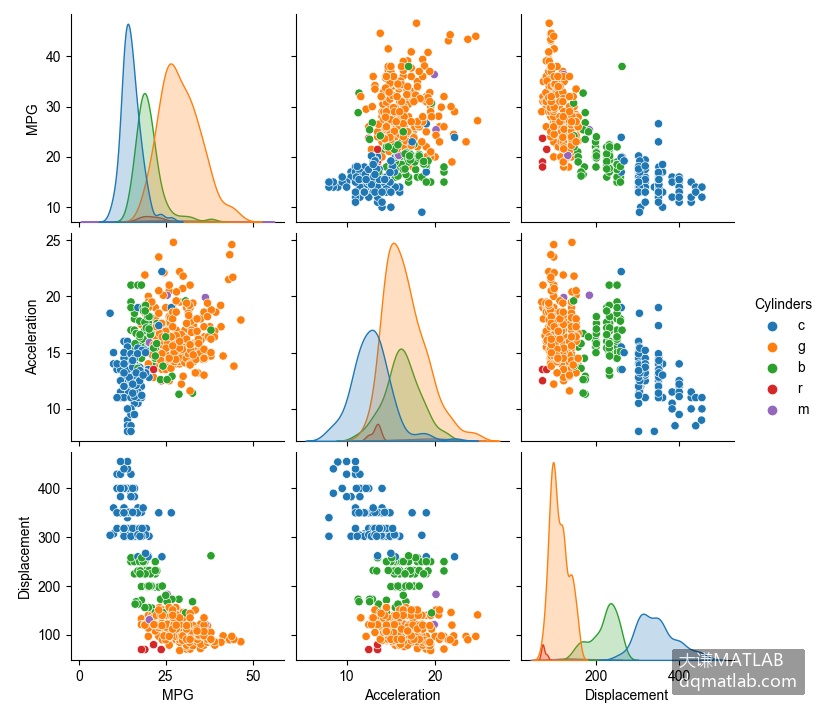
矩阵散点图用简单散点图组成矩阵来表现矩阵列数据两两之间的相关关系,或者用复合散点图矩阵表现矩阵和矩阵的列之间的相关关系。矩阵散点图的对角线上一般根据向量数据或矩阵数据绘制直方图或核密度估计曲线图。
\[\]
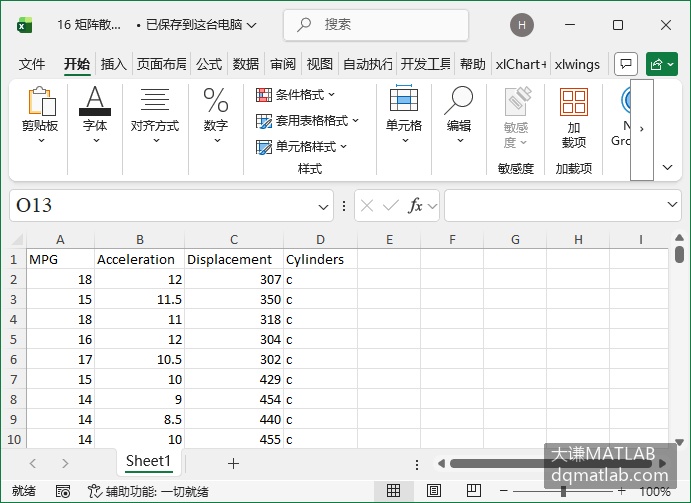
根据给定数据绘图,编写Seaborn代码如下所示:
code.python
import matplotlib.pyplot as plt    #导入Matplotlib包的pyplot子包
import pandas as pd    #导入pandas包
import seaborn as sns
df=pd.read_excel('16 矩阵散点图.xlsx',engine=';openpyxl')    #导入数据
fig=plt.figure()    #新建绘图窗口
sns.pairplot(df,hue='Cylinders')
sns.set(font_scale=1.2)
plt.show()
运行代码,生成下图。
\[\]